The 3-dot menu in the header
The 3-dot menu in the editor’s header gathers all global actions on the inspection: everything that does not happen directly inside a section or a subsection. This is the menu to know by heart, because it commands the report’s delivery.
How to access it
Click the 3-dot (vertical ellipsis) icon at the right of the header. A dropdown menu opens.
The seven menu entries
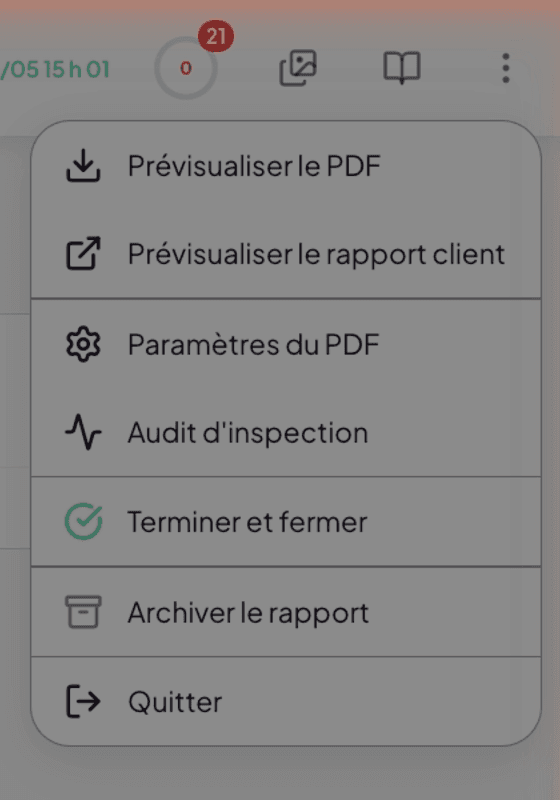
1. Preview PDF
Opens a preview of the PDF report as it will be generated, in a separate window. Useful for validating the layout, density, page breaks, and appearance before delivery.
The preview uses the inspection’s current PDF settings (see entry 3 below).
2. Preview client report
Opens the interactive web version of the report, as your client will see it. This version is navigable, with a clickable summary and zoomable photos.
This preview is invaluable to ensure the client-side experience is clear before launching delivery.
3. PDF Settings
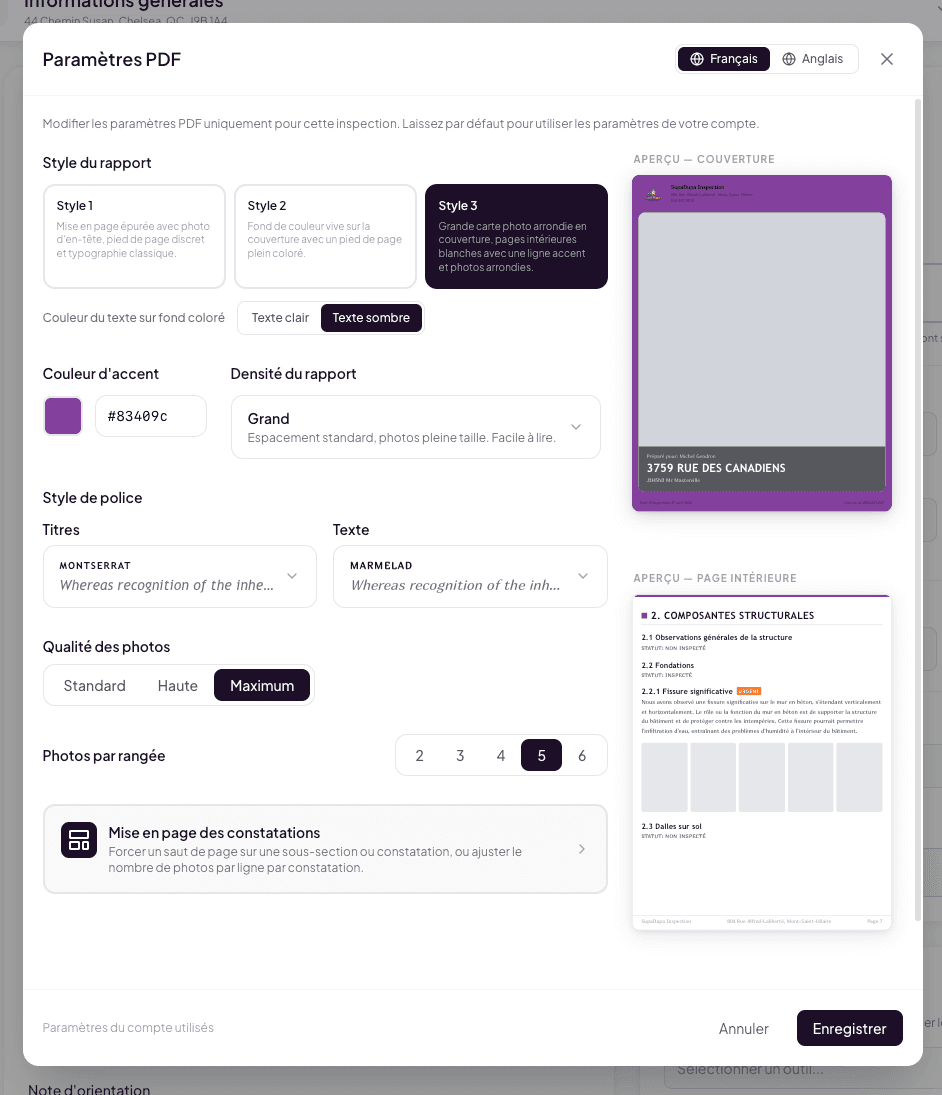
Opens a dedicated modal for customizing the PDF for this inspection. You can adjust:
- Report density — Large (default), Condensed, Ultra-condensed. Influences whitespace and document length.
- Photos per row — 2, 3 (default), 4, 5, or 6. Influences image size.
- Font style — Classic (Merriweather/Inter, default) or Modern (Montserrat/PT Serif).
- Accent color — a 10-color picker for headings and accents.
- Per-narrative customization — you can force a page break on a specific subsection or narrative, and adjust the number of photos per row for an individual narrative. Useful for critical sections that must start at the top of a page, or for photos that deserve a large format.
French / English toggle to configure both languages independently.
A message at the bottom indicates “Account settings used” when you have not customized anything for this inspection — Lumos then applies the global settings of your profile.
4. Inspection audit
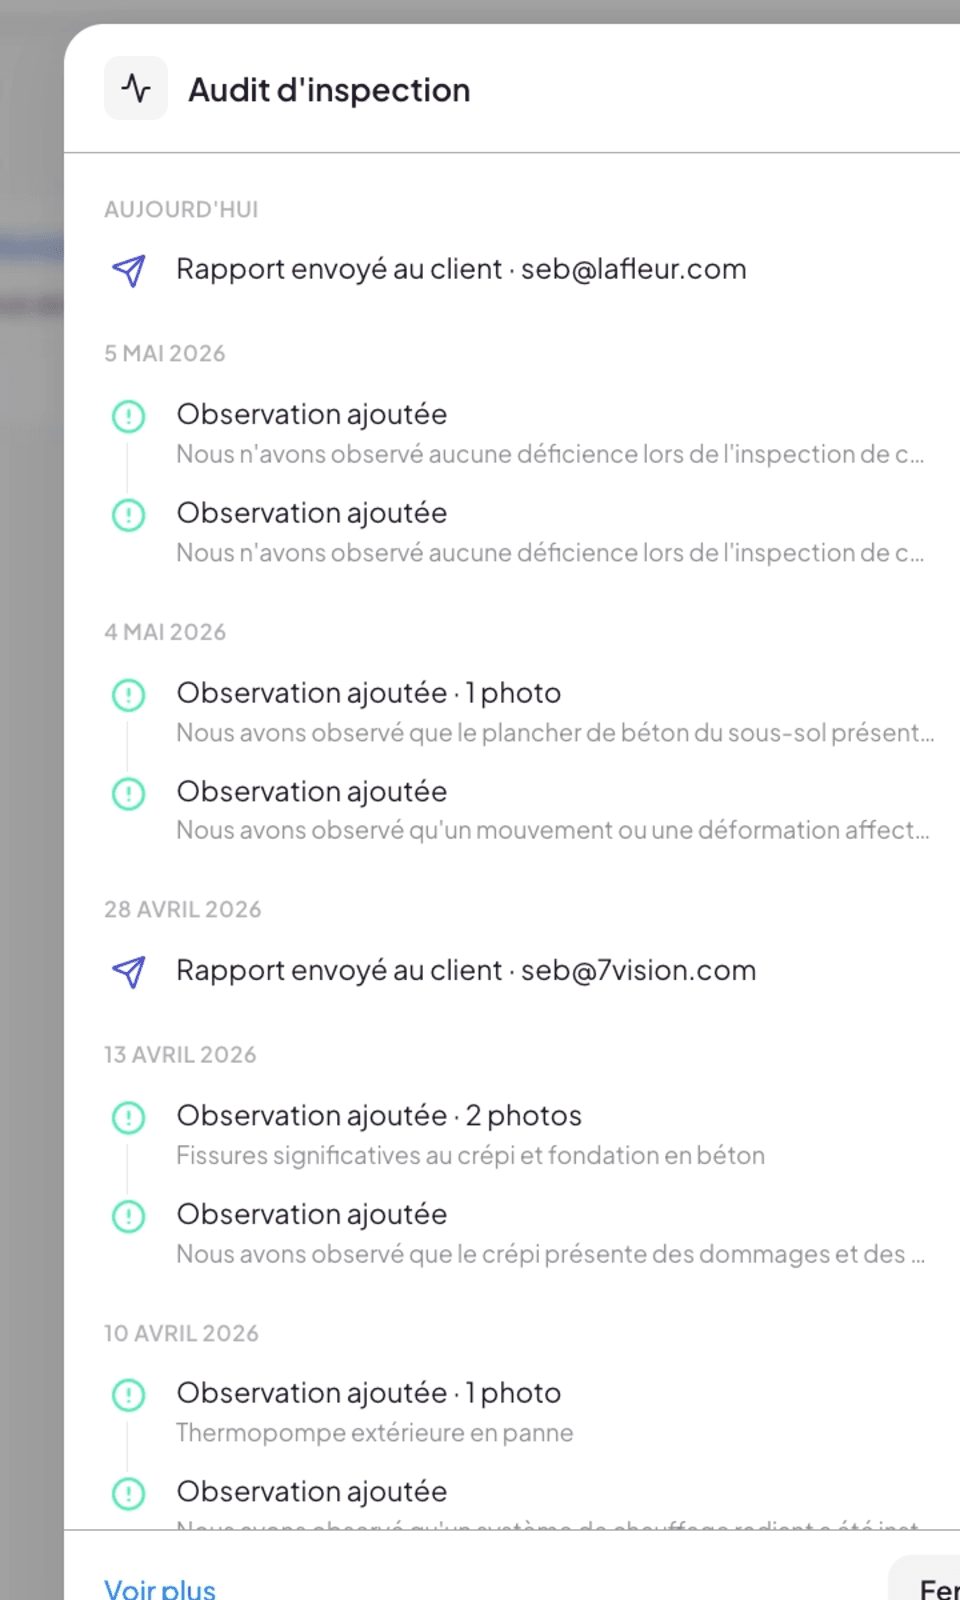
Opens a chronological timeline of all actions performed on this inspection. The modal shows:
- A header titled Inspection audit
- A paginated list of events grouped by day (“TODAY”, “MAY 5, 2026”, “APRIL 28, 2026”, etc.)
- A See more link at the bottom to load older events
- A Close button
Each line shows:
- An icon identifying the event type
- The label of the action (“Photo uploaded”, “Capture saved”, “Observation added”, “General Information modified”, “Inspection created”, etc.)
- A sub-label specifying the affected element (for example the title of the affected narrative)
- The time of the event, grouped by day (“YESTERDAY”, “TODAY”)
The audit acts as an inspection journal. Useful for reconstructing a chronology in case of a question on timing or for resuming an interrupted file.
5. Finalize and close
Marks the inspection as complete. The report is finalized and the status flips. The final invoice itself is created from step ③ Invoice of the Document Center, as soon as the quote is signed (see Create the final invoice).
Before clicking here, take the time to review your BNQ compliance audit and preview the report. Once finalized, the inspection closes cleanly.
6. Archive report
Archives the inspection: it leaves active inspections, frees visual space in your dashboard, but stays accessible if you filter on archives. Reversible action.
7. Exit
Leaves the editor and brings you back to the project’s record. All your changes have already been saved automatically, so nothing is lost.
See also
- The BNQ compliance gauge — to consult before Finalize and close
- The inspection editor — overview
- The interactive web report — the version delivered to the client
- Quote tracking